Hexagons are the Bestagons (JS edition) · Part one

As we all know, Hexagons are the Bestagons - we see them in honeycombs, they are in snowflakes and pencils, there’s one on Saturn, and they are... (math incoming) the only regular polygon to tile a plane without resorting to debasing self-divison 😅.
When I started rebuilding my website, I knew I wanted a live, configurable background and it quickly became clear it’ll be rendered on a canvas. I was playing around, drawing various 2D shapes, when I remembered the CGP Grey video - hexagons... The Bestagons were the obvious choice!
In this series of tutorials I’ll show you how I built this background.
Part one: how to render a hexagon?
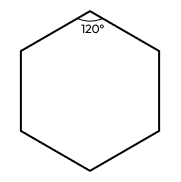
OK, so how do we render a regular hexagon? We want to draw 6 straight lines of equal length. To form a hexagon, the angle between every two sides has to be 120°.
Let’s explore our options for drawing stuff on a canvas. Here's some API methods from CanvasRenderingContext2D, the interface from the Canvas API that we use to draw in two dimensions:
- arc() - creates a circular arc. Hexagons only have straight walls,
arcis definitely not our thing; - ellipse() - creates an ellipse. Same as above, cool, but not for us;
- rect() - adds a rectangle to the current path. Finally, some straight lines. Still won’t work for us though - rectangles are obviously the inferior choice... and we can't really draw a hex using a full reactangle;
- lineTo() - adds a straight line to the current sub-path. This is our thing!
Unfortunately, there doesn’t seem to be anything more convenient in the API. No fillHex() function yet 🙄. We’ll have to draw our hexagons line by line.
So, let’s take a look at the lineTo() method - it accepts an x and a y coordinate. Here’s the example from MDN:
const canvas = document.getElementById("canvas");
const ctx = canvas.getContext("2d");

ctx.beginPath(); // Start a new path
ctx.moveTo(30, 50); // Move the pen to (30, 50)
ctx.lineTo(150, 100); // Draw a line to (150, 100)
ctx.stroke(); // Render the path
OK, so in order to draw a hex, we need to figure out the coordinates of all its vertices.
Computing the vertices
Let’s give the vertices of our future Hex names - A, B, C, D, E, F:
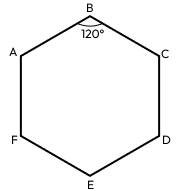
And let’s say we start from vertex A. Our code will then look something like this:
const canvas = document.getElementById("canvas");
const ctx = canvas.getContext("2d");

ctx.beginPath(); // Start a new path
ctx.moveTo(vertexA.x, vertexA.y); // move the pen to vertex A
ctx.lineTo(vertexB.x, vertexB.y); // draw a line from A to B
ctx.lineTo(vertexC.x, vertexC.y); // draw a line from B to C
ctx.lineTo(vertexD.x, vertexD.y); // draw a line from C to D
ctx.lineTo(vertexE.x, vertexE.y); // draw a line from D to E
ctx.lineTo(vertexF.x, vertexF.y); // draw a line from E to F
ctx.lineTo(vertexA.x, vertexA.y); // ...and finally, from F to A to finish the hex
ctx.closePath();
ctx.stroke(); // Render the path
The next question we have to answer is - if vertex A has coordinates (0, 0), where is vertex B?

First, we need to define the length of our hex’s side. Let’s hardcode it to 10px. Then, figure out where B is.
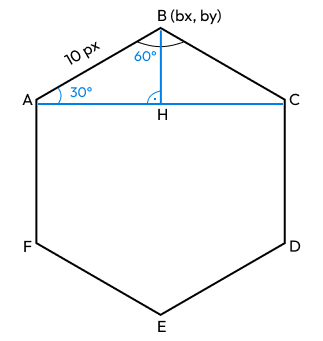
Let’s call the coordinates of A (ax, by) , and of B (bx, by) . We draw a line between A and C and the height of the ABC triangle - BH.
We can now see that:
bx == ax + length(AH)- B is straight on top of H, sobxis the same as thexcoordinate of H (hx); H islength(AH)away from A, sohxisax + length(AH)by == ay - length(BH)- B islength(BH)away from H, soby = hy - length(BH); and because A and H are on the samey→hyis the same asay.
If we find the lengths of AH and BH, we’re good to go. To find them, we need a bit of math “magic”:
∠AHBis 90°.∠ABHis half of∠ABC, so it’s 60°, therefore∠HABis 180 - (90 + 60) = 30°.- From trigonometry, we know that
length(AH) = cos(∠HAB) * length(AB), andlength(BH) = sin(∠AHB) * length(AB)
Let's call the length of AB hexSide, then:
length(AH) = cos(30°) * hexSidelength(BH) = sin(30°) * hexSide
Math over!
We’re mostly done with the math. Back to code!
const COS_30 = Math.cos(Math.PI / 6);
const SIN_30 = Math.sin(Math.PI / 6);

const hexSide: number = 10; // the side of our hex is hardcoded to 10px

// Note: in real life, lacking the diagram above, `AH` means nothing.
// I would keep this as `COS_30 * hexSide` or try to give a more
// meaningful name.
const AH = COS_30 * hexSide;
const BH = SIN_30 * hexSide;

const vertexA = { x: 0, y: 0 };
const vertexB = { x: vertexA.x + AH, y: vertexA.y - BH };
And we have our vertex B!
At this point I suggest you pause for a bit and try to figure out the coordinates of C, D, E, and F. Use what we already know - the coordinates of A and B, hexSide, AH, and BH.
Here’s the solution:
const vertexA = { x: 0, y: 0 };
const vertexB = { x: vertexA.x + AH, y: vertexA.y - BH };
const vertexC = { x: vertexB.x + AH, y: vertexA.y };
const vertexD = { x: vertexC.x, y: vertexC.y + hexSide };
const vertexE = { x: vertexB.x, y: vertexD.y + BH };
const vertexF = { x: vertexA.x, y: vertexD.y };
So, now that we have all vertex coordinates, we're finally ready to render our hexagon:
<html>
  <body>
    <canvas id="canvas"></canvas>
    <script>
    const COS_30 = Math.cos(Math.PI / 6);
    const SIN_30 = Math.sin(Math.PI / 6);

    // Coords of our first vertex.
    const start = { x: 100, y: 100 };

    // Length of our hex's side.
    const hexSide = 100;

    // Find or create a canvas.
    const canvas = document.querySelector('#canvas');
    canvas.width = 400;
    canvas.height = 400;

    const ctx = canvas.getContext('2d');

    // Compute the vertices (same as above).
    const vertexA = start;
    const vertexB = {
      x: vertexA.x + hexSide * COS_30,
      y: vertexA.y - hexSide * SIN_30
    };
    const vertexC = { x: vertexB.x + hexSide * COS_30, y: vertexA.y };
    const vertexD = { x: vertexC.x, y: vertexC.y + hexSide };
    const vertexE = { x: vertexB.x, y: vertexD.y + hexSide * SIN_30 };
    const vertexF = { x: vertexA.x, y: vertexA.y + hexSide };

    // List all vertices. Remember - we have to `lineTo()` to vertex A to
    // finish the hex.
    const vertices = [
      vertexA, vertexB, vertexC,
      vertexD, vertexE, vertexF, vertexA
    ];

    // Begin a new sub-path at vertex0.
    ctx.moveTo(vertices[0].x, vertices[0].y);
    ctx.beginPath();

    // Add line to the sub-path from each vertex to the next one.
    vertices.forEach(({ x, y }) => ctx.lineTo(x, y));

    // End the sub-path.
    ctx.closePath();

    // Set the stroke color for our hex.
    ctx.strokeStyle = 'rgb(0, 0, 0)';

    // And finally, our Bestagon:
    ctx.stroke();
    </script>
  </body>
</html>
And the outcome is:
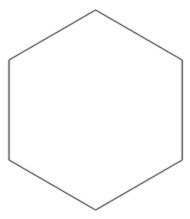
This is it for Part one! Thank you for reading!
In Part two we will continue with rendering multiple hexes on a grid. Stay tuned 😉